 |
|
|
| View previous topic :: View next topic |
| Author |
Message |
Mugwump


Joined: 28 Jul 2007
Location: Between London and Melbourne
|
| Post subject: |  |
|
^ there are a host of theories put forward to explain the declining violent crime rate in the US, none of which seem to quite fit the facts : inter alia, less lead in petrol, higher rates of abortion, age demographics, higher incarceration rates, changes in reporting standards, video games keeping young men off the streets, and better police tracking software. All will have had some part to play, I think.
Apart from the general decline of belief in authority, I believed that the best explanation for the 1960s surge was that the baby boom had raised the proportion of young men in the population. As this subsided, crime would fall. However, it was recently noted that the rate of criminality within the young male cohort has been falling in tandem with the wider population, which dampens (but does not entirely negate) the force of that explanation. I suspect high rates of immigration have also had a large part to play, as new immigrants tend to be employed, hard-working and law-abiding - expanding the denominator without adding much to the numerator. Lower unemployment rates since 1990 help, too. People lawfully occupied for 8 hours a day commit fewer violent crimes.
On the face of it, it would be a surprise if all of the factors above did not play some role. My money remains on immigration, longer incarceration times and the receding baby boom as the major factors. I also think that the video game argument is an intriguing one.
Violent crime rates, despite all this, remain at least double the rate of 1950-1960,and murder rates are similar despite medical technology advances which should have seen them fall 80%.
_________________
Two more flags before I die! |
|
|
|
 |
K
Joined: 09 Sep 2011
|
| Post subject: | |
|
I've been wanting to know the change in age demographics of countries over the centuries, especially the change in the percentage of the population in the 20- to 30-year-old male group. All I've seen so far is the graph of the life expectancy, which, of course, has greatly increased in the past few centuries (leading one to presume that cohort has dropped in proportion, but by how much?).
If anyone knows any sources of such info, please tell us.
Something like the following*, except for the past few centuries in Europe and N. America... and with numbers you can actually read...

* from The Economist. |
|
|
|
|
K
Joined: 09 Sep 2011
|
| Post subject: | |
|
This may be the only pre-20th-century plot I've seen:

I estimate that's about 9% 20-30-year-old males, would you say??
Germany in recent times has been about 6%, so, if that's a good estimate, there were only about 50% more in that cohort in relative terms than in modern times.
[For modern USA, the cohort comprised 8.0%, 7.3%, 8.3%, 7.1% in 1950, '70, '90, 2010.] |
|
|
|
|
K
Joined: 09 Sep 2011
|
| Post subject: | |
|
"Age distribution of violent offenders across time and space" (Eisner)
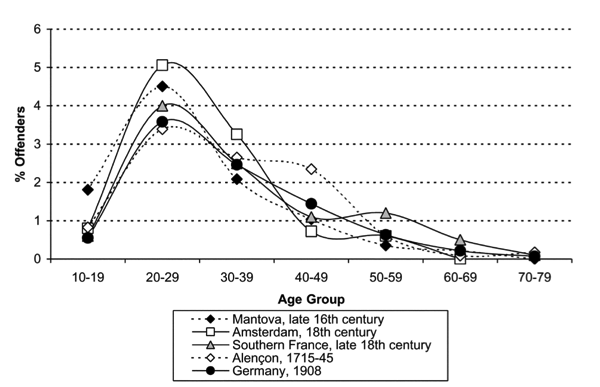
The data points are actually "the average percentage of offenders per year of age in the respective age group" [which I interpret as meaning that if you want to know the percentage within each age group, you should multiply the value of the point by 10 --- the potentially confusing vertical-axis labelling being because there are fitted lines through the points].
"[T]he data show a very similar pattern, with roughly 35�45 percent of the offenders in the twenty-to-twenty-nine-year age group..." |
|
|
|
|
K
Joined: 09 Sep 2011
|
| Post subject: | |
|
Income inequality is another factor suggested to be linked to violent crime.
Here is Piketty's first figure from the link on the previous page. [You need to be logged in to view it.] |
|
|
|
|
Mugwump
Joined: 28 Jul 2007
Location: Between London and Melbourne
|
| Post subject: | |
|
^ Doesn�t really bear out the thesis. Income inequality in the 1970s remained low but violent crime rates took off at least a decade earlier. Some lag is conceivable, but 12 years or so seems unlikely to me.
Drugs, demographics, deviance (tolerance/glorification of), and divorce seem the most likely catalysts behind the 1960s surge.
_________________
Two more flags before I die! |
|
|
|
|
K
Joined: 09 Sep 2011
|
| Post subject: | |
|
One might guess that income inequality may be a strong factor in differences on large time scales or between different regions and countries, but that decades are too short a time scale.* (How could people tangibly feel fluctuations in societal inequality on such short scales?)
And the "violent" age group percentage just wiggled up and down by <20% across those few decades, so that doesn't give much reason to focus on that factor either.
* I should say, though, that the graph above is probably not the best indicator of income inequality. |
|
|
|
|
K
Joined: 09 Sep 2011
|
| Post subject: | |
|
http://www.pbs.org/fmc/interviews/currie.htm
Elliott Currie (Dept. of Criminology, Law and Society, UC Irvine):
"What caused the sharp increase in crime during the 1960s is a pretty complicated set of events. Some people think that it's fairly peculiar that crime went up in the '60s because after all we were an affluent society with prosperity booming all around. The economy was doing very well. And while all this was true, there were other things happening at the same time beneath it. We had people flooding into the cities, mostly people who had been agricultural workers, who were now casualties of the mechanization of agriculture, particularly in the South. They were now coming up to the cities looking for unskilled jobs, the kind that they could do, which were on the decline as a result of the beginnings of de-industrialization of the cities.
So you had a peculiar situation in which on the one hand some people were doing very, very well, and much better, in fact, than they had probably ever dreamed, but a variety of people, and lots of people, not just a few of them, were being pretty well excluded from that kind of general affluence and prosperity."
...
"And it's very important to keep in mind that the level of serious violent crime that we suffer in the United States and have suffered since the late 1960s is not one that's common to other industrial societies around the world."
...
"You can't lock up humongous portions of your population and not have some effect on the crime rates. So the real question about the effect of incarceration on crime is how much of an effect at what cost, both in material terms and in social values. And on those counts I think the verdict on incarceration as a social policy for controlling crime is really in: You can accomplish some crime reduction with it, particularly for certain kinds of crime, but as a cost-effective system it fails the test. And I think it also fails the test of social values.
The most obvious problem with the notion that the thug in prison can't shoot your sister is that the thug had to shoot your sister or otherwise do somebody great harm in order to get into prison in the first place. So as a preventive device, as a way of keeping crime from happening in the first place, it obviously falls flat."
...
"Crime rates have declined in the 1990s. Much is made of this. The decline is very real and in some places it's quite dramatic. It's important to remember that the declines, however, follow one of the most extraordinary rises that we've ever seen in our history, a rise that matches that in the late 1960s, so that beginning in the middle of the 1980s we had particularly among youth, a very, remarkable, dramatic, tragic increase in serious violent crime. That lasted up until the early 1990s. So if you look at this on a graph, it isn't some kind of steady drop. It's a fall-off from a peak that was itself quite high."
...
"Why we have the declines in crime in the 1990s is a very complicated picture. For my money, the most important single factor has to do with the health of the economy, because what this has done is the vast numbers of jobs that we have created have actually reached far down the social ladder. So that a lot of people, particularly young men, who until the beginning of the 1990s were likely to be outside of the labor force altogether, are now being pulled into the labor force - not necessarily in such wonderful jobs, but in jobs that are legitimate, that give them a sense of participation in the legitimate economy. They are working in jobs that take them off the street, which is a dangerous place to be for them and others around them, that take them out of bars and out of the drug trade and so on. So a very dramatic improvement in the lives of those people.
And if you look at how the crime rates have declined in relationship to the decline of the unemployment rate among young inner city men, for example, you see them tracking each other very, very closely. " |
|
|
|
|
David 
I dare you to try

Joined: 27 Jul 2003
Location: Andromeda
|
| Post subject: | |
|
| Quote: | | And it's very important to keep in mind that the level of serious violent crime that we suffer in the United States and have suffered since the late 1960s is not one that's common to other industrial societies around the world. |
That�s an interesting point � and I presume he�s basing that on something. Is this trend present in Australia? How about continental European countries? If so, it might not be enough to prove Mugwump�s thesis, but you�d think it�d have to be for it to hold water.
_________________
All watched over by machines of loving grace |
|
|
|
|
K
Joined: 09 Sep 2011
|
| Post subject: | |
|
For the England and Canada homicide rates, see the graphs on the previous page (if you're willing to trust Pinker's ability to copy other people's stuff accurately). They presumably correspond to Figs. 3-10 and 3-18 in the BA book. (David, can you confirm this?) Figure 3-19 in the same book is for "five Western European countries". Oh, I guess it's this:
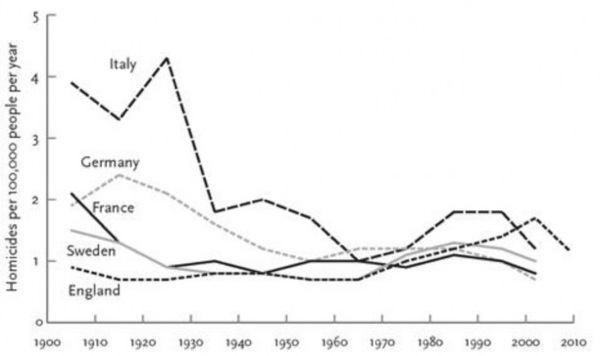
You'll note that this plot is not all that good: There's just one data point per decade. (David, what are the stated sources of the data for this figure?)
Here is the Oz homicide rate. [log in to view]
You'll note that this plot seems weird: The horizontal scale alternates between intervals of 8 and 9 years. [But see my comment below once I've updated it.]
Last edited by K on Sun Jun 17, 2018 12:06 am; edited 1 time in total |
|
|
|
|
K
Joined: 09 Sep 2011
|
| Post subject: | |
|
Homicide Rate (including homicide attempts*) in Japan, 1888-2003 � Johnson (2006).
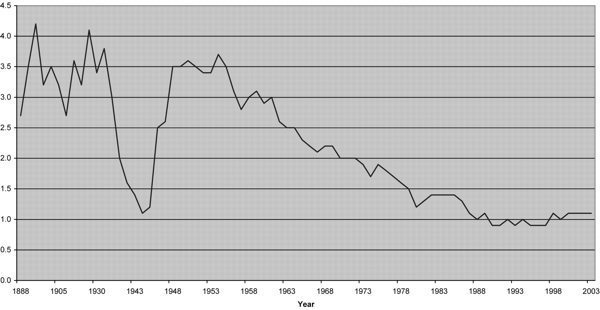
* Apparently, attempts are about 50% of the total, so halve the numbers for completed homicides. |
|
|
|
|
David
I dare you to try
Joined: 27 Jul 2003
Location: Andromeda
|
| Post subject: | |
|
The Western European countries graph is from Manuel Eisner (except for the English data, which is taken from 'Walker et al.'). The source for the data is on p. 297 of the study below (you'll see why there's only one plot point per decade; these are aggregate figures):
https://www.vrc.crim.cam.ac.uk/vrcresearch/paperdownload/manuel-eisner-increase-in-interpersonal-violence.pdf
Not sure what your problem with the Australian graph is ��clearly the x axis has just been divided into intervals of 8.5 years (presumably, to enable even markers). It doesn't affect the actual data shown.
_________________
All watched over by machines of loving grace |
|
|
|
|
K
Joined: 09 Sep 2011
|
| Post subject: | |
|
Thanks for the source info.
Having now looked a bit at Eisner's paper, I see p.297 contains Table 3, "Average homicide rates in seventeen European countries", which contains numbers for decades from 1840-49 onwards. I assume you actually mean Pinker (or someone for him) plotted data from that table (and Walker et al.) to make his Fig. 3-19 shown above.
Actually, Eisner's paper contains respectable graphs with similar info: Figures 2 to 4, on pages 299-301. It would have been better (graph-wise) if Pinker had just quoted (one or more of) these graphs. Eisner's Figs. 2 to 4 show that, at least for those countries, he has data of higher resolution than in the table. But maybe for some reason Pinker wanted specifically the countries England, Sweden, France, Germany, Italy in one graph, and Walker et al's England data rather than Eisner's. If that's what he wanted, perhaps he should have looked for or asked for the more finely binned data. If that's too much work, Pinker or his associate should arguably just have gone with a bar graph or a dot graph: the lines are essentially meaningless; they certainly do not represent what is happening between two points in time.
In this post, I originally wrote that "I haven't got out a ruler and checked, but those x-axis check marks for the Oz graph better not be evenly spaced, or else the numbers on them are false. I do hope the length proportions are 8:9, because it's far better to be weird than to be untrue." It's still true that I haven't got out a ruler, but magnifying the plot in the web browser I think the axis marks are evenly spaced. I do not think it is acceptable to express falsehoods deliberately, simply because you cannot be bothered to be truthful. I mean, I think it's safe to say Mr. M. is plotting the homicide figures (per 100,000) for whole years, not for (e.g.) a single day, so it's not as if you have data for the 1st of January of one year and 1st of July of another year. (Even in that case, that info would not be conveyed adequately by the labels "1915, 1923, 1932,...".)
A question or eye-test for everyone:
Does the Walker et al. England curve agree with the corresponding curves on previously displayed graphs (in the posts http://magpies.net/nick/bb/viewtopic.php?p=1839230#1839230 and http://magpies.net/nick/bb/viewtopic.php?p=1840487#1840487 )?
[I had a brief look after I posed this question and, from memory, thought they roughly agreed, but not exactly.]
Last edited by K on Mon Jun 18, 2018 2:44 pm; edited 1 time in total |
|
|
|
|
David
I dare you to try
Joined: 27 Jul 2003
Location: Andromeda
|
| Post subject: | |
|
Out of curiosity, may I briefly interject at this point and ask what your background is? Do you work as a statistician, or is this just a lay interest?
_________________
All watched over by machines of loving grace |
|
|
|
|
K
Joined: 09 Sep 2011
|
| Post subject: | |
|
Note: I've just edited my previous comment...
And here is a table from the same Eisner paper (that David provided the link to) relevant (along with the graphs above) to the alleged "increase in homicide rates starting in the 60s".
Table 4: Lower and upper turning points of homcide rates, 1945-2004, sorted by homicide rate at lower turning point
Average 1960 0.71 1992 1.78 179%
Note: Lower turning point computed as the lowest average homicide rate over a five-year period, year shown is the middle year of the period. |
|
|
|
|
|
|
|
You cannot post new topics in this forum
You cannot reply to topics in this forum
You cannot edit your posts in this forum
You cannot delete your posts in this forum
You cannot vote in polls in this forum
You cannot attach files in this forum
You cannot download files in this forum
|
|